In this module you will learn how to use the Table Sorter Power BI Custom Visual. The Table Sorter allows you to rapidly re-sort and rank values within a table.
Module 46 – Table Sorter
Downloads
Key Takeaways
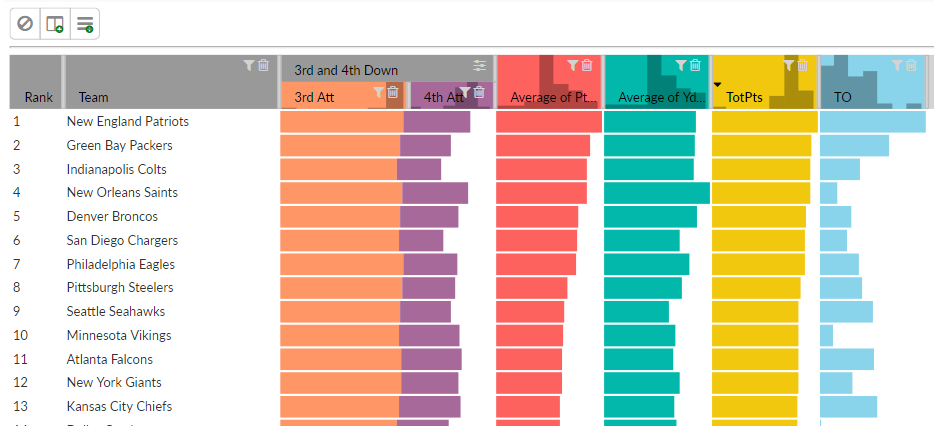
- Column in the table can show a rank value, attributes and measures.
- Allows you to build stacked table columns to explore combinations and weighting.
- Column headers can show the distribution of values in a Histogram.
This Table Sorter shows a rank of NFL offenses by various metrics.
- Under the Format paintbrush there are several customizations available for the Table Sorter.
- Under the Presentation section you have several properties you can adjust. Let’s highlight a few:
- Units and Precision have to do with the formatting of the values in the table.
- Turning on the Stacked property adjusts any Stacked Columns you’ve created to stack the values together.
- Using the Values displays labels on every value in the table.
- The Histogram property is turned on by default. Turning this off removes the Histograms in the column headers.
- Using the Animation property can either turn on/off the interaction you see in the table as you select values to re-sort by. When turned off, the re-sorting occurs without the smooth transition.
- Table tooltips is a nice feature you will see as you hover above values in the table.
- In the Selection section you can make the Table Sorter multi-selectable by turning on the Multi Select feature.
In addition to these properties, there are settings that appear on every visual to adjust the background color, add a border around the visual and lock the aspect ratio.
Find Out More
You will always be able to find this video module and advanced viewings of future modules on the Pragmatic Works On-Demand Training platform or view my previous blog posts.