In this introductory video, Manuel Quintana from Pragmatic Works walks viewers through the fundamentals of the Kusto Query Language (KQL), a powerful tool used for querying streaming data within Microsoft Fabric’s Real-Time Intelligence (RTI) environment. This session is part of a broader series on RTI and aims to demystify KQL for beginners, especially those transitioning from SQL or Power BI backgrounds.
What is KQL?
KQL is a query language designed to retrieve and process data from streaming sources. While it is central to Microsoft Fabric’s RTI, it is also used in services like Azure Data Explorer, Azure Monitor, Log Analytics, and Microsoft Sentinel. KQL allows users to perform operations similar to SQL, such as filtering, joining tables, and creating calculated columns.
Key Differences Between KQL and SQL
- No
FROM clause – simply start with the table name.
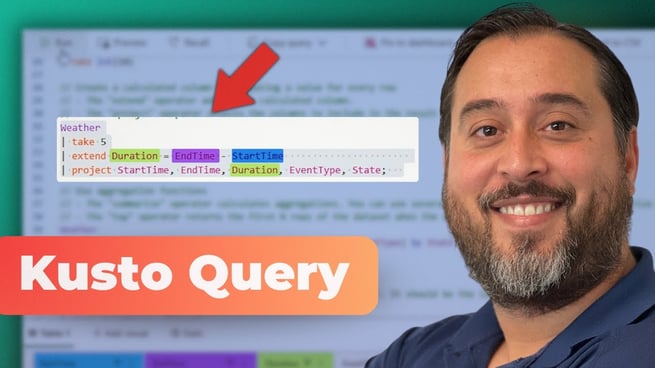
SELECT is replaced by project.WHERE, ORDER BY, and JOIN are still used but with slightly different syntax.extend is used for calculated columns.take is used instead of TOP to retrieve a set number of rows.
Why KQL Feels Familiar Yet Powerful
Manuel describes KQL as a blend of SQL, Power Query, and even Python due to its rich set of built-in functions and transformation capabilities. The syntax is intuitive and readable, making it accessible for those new to query languages.
Basic Syntax and Operations
- Start with the table name.
- Use the pipe symbol
| to chain operations.
- Apply commands like
count, take, project, extend, and summarize.
- Use
render to visualize data directly within the query set.
Hands-On Example: Weather Analytics
Manuel demonstrates KQL using a weather-related dataset in a Fabric-enabled workspace. He shows how to:
- Query the table directly by name.
- Use
take to retrieve top rows.
- Calculate storm duration using
extend.
- Aggregate data with
summarize to count storms by state and event type.
- Visualize results using built-in charting options like pie and column charts.
SQL to KQL Transition Made Easy
A standout feature is the explain command, which allows users to write SQL and see its KQL equivalent. This is especially helpful for those migrating from SQL and learning KQL syntax.
Sharing and Visualization
KQL queries can be saved and shared within the workspace. Users can pin queries to dashboards, making it easier to share insights across teams. While ad hoc analysis is supported within the query set, dashboards are recommended for broader organizational sharing.
Looking Ahead
Manuel hints at future videos covering advanced KQL topics like update and mirror policies, which tie into medallion architecture and deeper RTI capabilities. He encourages viewers to explore sample datasets and continue building their KQL skills.
This video serves as a solid foundation for anyone looking to get started with KQL, especially within the context of Microsoft Fabric and real-time data processing.
Don't forget to check out the Pragmatic Works' on-demand learning platform for more insightful content and training sessions on KQL and other Microsoft applications. Be sure to subscribe to the Pragmatic Works YouTube channel to stay up-to-date on the latest tips and tricks.







-1.png)
Leave a comment