<img height="1" width="1" style="display:none" src="https://www.facebook.com/tr?id=612681139262614&amp;ev=PageView&amp;noscript=1">
Skip to content

Need help? Talk to an expert: phone(904) 638-5743

Power BI Custom Visuals- Acterys Matrix Light

Power BI Custom Visuals- Acterys Matrix Light

Power-BI-Banner.jpg

In this module you will learn how to use the Acterys Matrix Light. Acterys Matrix Light is designed primarily for financial planning and budgeting but works similar to a traditional Excel PivotTable.

Module 112 – Acterys Matrix Light

Downloads

Key Takeaways

  • Works similarly to a traditional Excel PivotTable.
  • Able to display filtered values on top.

image

This Acterys Matrix Light shows the Revenue by subcategory and year.

Under the Format paintbrush you will find there are a few customizations that you can enable for this visual.

  • Using the Show Total section you can determine if total values are displayed on columns or on rows.

image

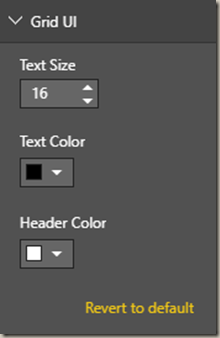
  • Changing the Grid UI section allows you to modify the formatting of the text within the matrix.

image

You can also adjust the background color, add a border around the visual and lock the aspect ratio under the Format section.

Find Out More

You will always be able to find this video module and advanced viewing of future modules on the Pragmatic Works On-Demand Training platform or view my previous blog posts.


Sign-up now and get instant access

Leave a comment

Free Trial

On-demand learning

Most Recent

private training

Hackathons, enterprise training, virtual monitoring