Python for Data Analysts - Learn With The Nerds
In the July 2025 edition of Pragmatic Works’ Learn With The Nerds, Zane Goodman leads an engaging and practical session on using Python for data analysis. This session is tailored for beginners and intermediate users looking to harness the power of Python and its libraries, particularly pandas, for data manipulation and visualization.
Why Python for Data Analysis?
- Ease of Use: Python’s readable and intuitive syntax makes it accessible for beginners and efficient for experienced analysts.
- Extensive Libraries: Libraries like pandas, NumPy, matplotlib, and seaborn provide robust tools for data manipulation and visualization.
- Integration: Python integrates seamlessly with databases, APIs, and file formats like CSV, Excel, and JSON.
- Community Support: A large, active community ensures abundant resources and support.
- Flexibility: Python scales from small tasks to big data processing and integrates with cloud platforms.
Getting Started with Jupyter Notebooks
Zane introduces Jupyter Notebooks as the primary environment for writing and executing Python code. He demonstrates how to launch Jupyter Lab via the browser using Jupyter Light, allowing users to follow along without installing software.
Data Ingestion and Exploration
Participants learn how to import CSV files into pandas DataFrames and explore the structure of the data. The dataset, themed around a fictional underground robot fighting league, includes information on robots, fights, teams, and tournament earnings.
Key Data Analysis Techniques
- Filtering: Using boolean indexing to filter rows based on conditions (e.g., robots with attack power > 85).
- Data Types: Checking and converting data types using
.dtypes and .astype().
- Aggregation: Grouping data with
.groupby() and applying functions like count() and sum().
- Merging: Combining multiple DataFrames using
pd.merge() to analyze relationships between robots, teams, and earnings.
- Handling Missing Data: Using
.fillna() to replace null values.
Advanced Aggregation with .agg() and .transform()
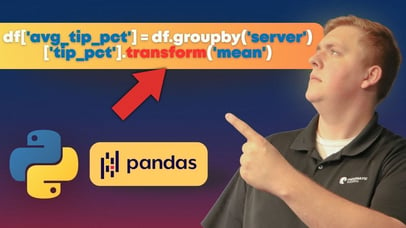
Zane explains how to use .agg() for multiple aggregations and .transform() to retain the original DataFrame shape while adding new calculated columns, such as total team earnings.
Data Visualization with Matplotlib
The session concludes with a demonstration of creating bar charts using matplotlib. Zane visualizes the number of fights won and lost by each robot, showcasing how to customize plots with labels, legends, and colors.
Final Thoughts
This session provides a comprehensive introduction to Python for data analysis, emphasizing practical skills and real-world applications. Zane’s engaging teaching style and the fun robot-themed dataset make learning both informative and enjoyable. For those interested in diving deeper, Pragmatic Works offers both live bootcamps and on-demand courses covering similar content.
Don't forget to check out the Pragmatic Works' on-demand learning platform for more insightful content and training sessions on Python and other Microsoft applications. Be sure to subscribe to the Pragmatic Works YouTube channel to stay up-to-date on the latest tips and tricks.




.png?width=406&name=Custom%20Libraries%20in%20Databricks%20(1).png)


-1.png)
Leave a comment