Allison Gonzalez, a Microsoft Certified Trainer at Pragmatic Works, recently hosted a full one-and-a-half-hour Excel session for Learn with the Nerds. Due to high demand, she has decided to provide a detailed walkthrough on building the dashboard showcased at the end of the session. This guide is meant for those who have watched the Learn with the Nerds session and are ready to dive into the dashboard construction process step-by-step.
Getting Started
- Preparation: Before starting the dashboard build, Allison recommends watching the full Learn with the Nerds session if you haven't already. The session is packed with valuable Excel tips and the class files are available for download to follow along.
Dashboard Design and Data Preparation
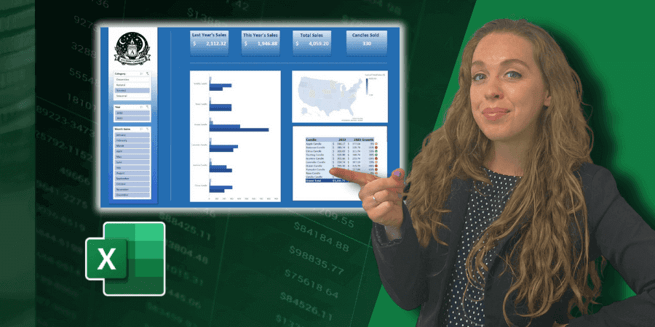
- Data Overview: The dashboard is based on two years of candle sales data, featuring interactive slicers for data sorting by candle category, year, and month. It provides a dynamic way for end-users to interact with the data.
- Initial Steps: Allison begins with data that has been cleaned using Power Query and loaded into a pivot table. The pivot table includes product names, quantities sold, total sales, and sales by year.
Structuring the Dashboard
- Planning: The importance of planning the dashboard layout is emphasized. Allison suggests using a wireframe or sketching out the design on paper or PowerPoint before starting the build in Excel.
- Slicers and Metrics: The dashboard includes slicers for filtering data and key metrics such as last year's sales, this year's sales, total sales, and the total quantity of candles sold.
Building the Dashboard
- Visual Elements: Alison demonstrates how to use shapes and conditional formatting to make the dashboard visually appealing and informative. She uses a variety of Excel features to enhance the dashboard's functionality, including pivot tables, slicers, charts, and maps.
- Interactivity: The dashboard's interactive features allow users to drill down into specific data points. However, some elements like the map need to be static due to Excel's limitations.
Final Touches
- Adjustments and Enhancements: Alison walks through the process of adjusting visual elements, aligning items, and ensuring that the dashboard is both functional and aesthetically pleasing.
- Testing and Refinement: Testing the dashboard's interactivity and making refinements based on user feedback or additional data insights is a critical step in the process.
Conclusion
Building a dashboard in Excel requires a thoughtful approach to data preparation, design planning, and execution. Allison's guide provides a comprehensive overview of the process, from initial planning to final adjustments. By following her step-by-step instructions, users can create a dynamic and interactive dashboard that effectively communicates key data insights.
Allison's commitment to sharing her Excel expertise is evident in her detailed walkthrough. For those looking to deepen their Excel skills and create impactful dashboards, her guide serves as a valuable resource. Stay tuned for more Excel tips and tutorials from Allison throughout the year.
Key Takeaways
- Preparation is key: Ensure you have the cleaned data and a clear plan before starting.
- Utilize Excel's features: Leverage pivot tables, slicers, and conditional formatting to build a functional and visually appealing dashboard.
- Test and refine: Always test your dashboard's functionality and make necessary adjustments to improve user experience.
Through Alison Gonzalez's expert guidance, even beginners can embark on creating their own Excel dashboards, transforming raw data into interactive and insightful visual representations.
Don't forget to check out the Pragmatic Works' on-demand learning platform for more insightful content and training sessions on Excel and other Microsoft applications. Be sure to subscribe to the Pragmatic Works YouTube channel to stay up-to-date on the latest tips and tricks.


-1.png)
Leave a comment