

Power BI Performance Tips and Techniques update:
Back in March of this year I created an article and a webinar for the Pragmatic Works Blog.
The original concepts still hold, Power BI and Excel Power Query are very powerful tools for building data models and sharing data discovery and visualizations. As you move from initial prototyping to a more mature model you may find that performance can be bogged down if you don't manage the structure of your reporting information. This talk provides Tips and Techniques to manage this information (link to updated slides).

Since the original webinar I have presented this topic at a few user groups and SQL Saturdays and was asked some very good questions.
I'd like to answer these questions here, and to update the slide deck as well.
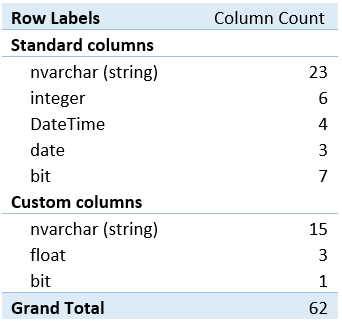
1) In Providence at the BI User Group I was asked: What happens in Kasper de Jonge's Memory Usage Tool macro when there is a join between two queries loaded into the model?

If the join is done in the data load, the data model contains only one table, as in the example discussed in the original presentation.
If there is a relationship created between two tables loaded in to memory, the joined tables are both shown in the pivot tables that result from the macro, and how much memory taken by each column is shown as a datatype and total for the column.
2) In NYC at the Power BI User Group a member asked: Does the HierarchySlicer cause performance problems?
To test this, I used a data table with nearly 14M rows linked to a Date table. Power BI connected via direct query to SQL Server 2016.
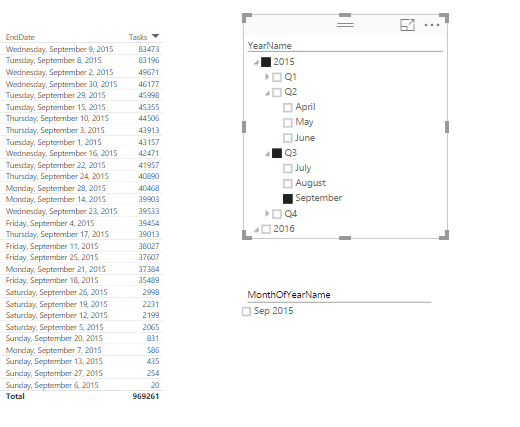
The Hierarchy Slicer (HierarchySlicer.0.7.9.pbiviz) at Year / Month on the Date table compared to a "flat" YearMonthName non hierarchical slicer. In this case, each new slicer selection took about 2 seconds to repopulate the summary table to the left. The two took the same amount of time, I did not see a difference in performance.
3) At SQL Saturday in Dallas this question came up: Is the SSAS formula engine still single threaded in Power BI on the portal as it is on the desktop? The SSAS engine is the same in Power BI on app.powerBI.com as it is on your local drive. There would not be an improvement on calculations caused by multi-threading, although the local machine may or may not have more resources to dedicate to the formula engine thread.
Thank you all for the great questions, please comment on others questions or if you have more information!


-1.png)
Leave a comment