<img height="1" width="1" style="display:none" src="https://www.facebook.com/tr?id=612681139262614&amp;ev=PageView&amp;noscript=1">
Skip to content

Need help? Talk to an expert: phone(904) 638-5743

How a Supply Chain Distribution Report Can Transform Your Business

How a Supply Chain Distribution Report Can Transform Your Business

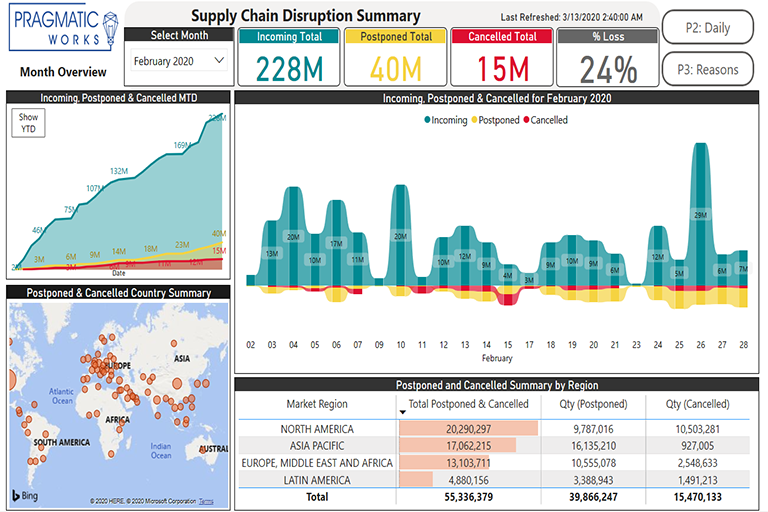
Pragmatic Works’ Supply Chain Distribution Report represents a sample of the fully customizable Business Intelligence reports that Pragmatic Works can provide for your organization. This report provides insights into what causes orders to be delayed or cancelled. With multiple filters and views, customers can easily see which market regions are affected, and the reasons that caused the postponement or cancellation.

Users can view these metrics by day, month, or year to see how they increase or decrease over time. They are also able to see the things like shutdowns and natural disasters that may have caused the disruption in the supply chain.

Features of the report:

  • The first page of the report calls out supply chain distribution such as incoming total, postponed total, and cancelled total. For the purposes of this report, we looked specifically at what causes orders to be cancelled or postponed. With the ribbon tool, we can call up any specific day and find a tool tip calling out those metrics. At the bottom, we can see the totals by market region and again a tool tip appears that will show us that market region’s performance across the selected month. We can see cancelled and postponed orders by country and month-to-date summaries, and with a quick click of a button we can also switch to see year-to-date trends.
  • On the second page, we are looking specifically at day-to-day changes. How are regions performing today vs. yesterday? We can expand these regions to view by business or by customer as well. We also have access to forecasting tools, along with the ability to add certain metrics to see how they might impact certain region or business cancellations or postponements.

  • On the third page, we have access to a decomposition tree, which allows us to look and toggle between cancelled and postponed orders and move multiple dimensions to see how they might impact our view. On the left we can interact with a “Reasons for Change” chart and see how occurrences such as natural disasters might affect our supply change. We also can look at item numbers and see how that item # or reason might influence our view.

This is just a sample of the solutions that Pragmatic Works can provide for your organization. As a Microsoft certified partner, we can help your organization gain valuable insights into your data with our fully customizable solutions. Contact us at Sales@pragmaticworks.com to discover how we help your organization connect large amounts of data to provide your businesses with interactive insights.

You can view the video summary of the Supply Chain Distribution on our Microsoft Partner Showcase here, https://powerbi.microsoft.com/en-us/partner-showcase/pragmatic-supply-chain-disruption/.

Supply Chain Report


Sign-up now and get instant access

Leave a comment

Free Trial

On-demand learning

Most Recent

private training

Hackathons, enterprise training, virtual monitoring