


Up-Up-Down-Down-Left-Right-Left-Right-B-A
This was a series of commands, a holy "code" that I whispered to myself over and over again on the walk home from school until it was etched in my 6th-grade brain. Earlier that day was the first time "the code" was mentioned-- whispered about at the lunch table because my buddy Rick's older brother told him it was "technically a cheat code" and we could all go to jail or worse if we told people we knew.
It was dangerous. It was alluring. And I was eleven walking home to beat Contra for the first time.
Twenty-five plus years later and cheat-codes still seem a bit enticing.
Apart from trying to learn the hard, advanced technical background of all that is Power BI, there is also another world out there of quick tips and tricks that are not talked about as much. Now, I have been lucky to be surrounded by coworkers who have helped me with them. I feel like these are those cheat codes in a video game that were shared at middle school cafeteria tables. Here are three I have been using quite a bit and would be useful for someone who is starting out their journey in Power BI.
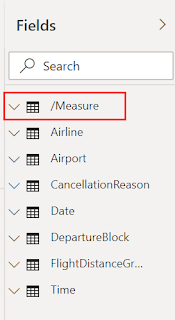
1) Make a measures table to house all of your calculated measures you make using DAX. The reason I like this is that most measures we use to analyze our data will apply to multiple tables because a measure doesn’t need to have a relationship with a table to work. We also will use measures within other measures, so it can get confusing to an end-user why one measure is housed in one table of data in our fields pane even though we use it for other calculations.
I also like to put a special character in front of my table name so that it either is always located at the top in my field pane or at the very bottom. I usually use a forward slash “/” to get it right at the top.
To make a table when in report view, go to the home ribbon and click Enter Data.
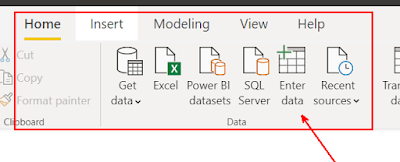
No need to put in any info into the table at this point. Just name your table and click load. Again, I like to put that forward slash in front so it will bring this table to the top of the fields pane.
And voila you have a measures table where you can house all measures for your reports
2) When we get a copious amount of dimension tables you are usually guaranteed to have lots of key columns. We know these are important to make our relationships in the model view so our tables can talk and share data with one another. (Here is a blog I wrote about that vital info.)
After those relationships are done, there is no need for our end-user to see those key columns. We can, of course, right-click on them in the fields view and select hide column. What if we have 20 or so key columns though? Who wants to waste their time going through that whole process? I’m sure I could use those extra 5-8 minutes searching up "Do they still make Contra or Mike Tyson Punch-Out?"
So here is your fix: Go to the modeling view. Expand the table you want to hide your key columns and then control select them. Then, in your properties pane right next to the field pane you can toggle the switch “Is Hidden” to “On”.
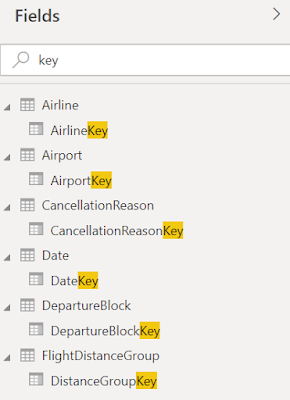
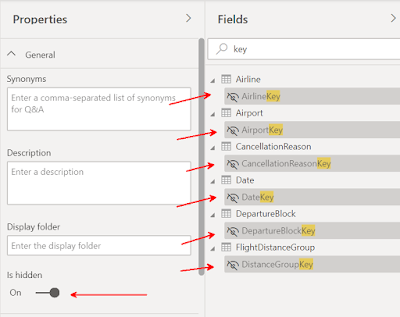
You want to make it even faster? If the people who prepared the data for you put the word key in the columns that have key data for our relationships you are Oh So Lucky. In the fields pane, type the word key, and all the columns with the key in it will show up from ALL of your tables. Now control select and mark “Is Hidden” to “On”.
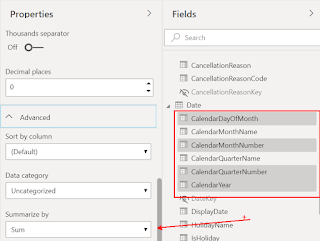
3) This ties into the last shortcut. Power BI will take any whole number data type that was designated in the Power Query editor and implicitly do a default summarization on it. Well, many times we don’t want the data for those columns summarized when we put them in a visual. Think dates as a prime example. We can go to the fields pane, click (Not Check) the column we don’t want to be summarized, and then go to the column tools ribbon and switch it from “Sum” to “Don’t Summarize”. Not a hard thing to do, but if we have lots of columns in our data that we don’t want to be summarized this could be a bear.
Like earlier, we are headed to the model view. Control-click all the columns in the field pane that you don’t want to be summarized. Now, click on the Advanced option in the properties pane, go to summarize by and change to “None”
.png?width=320&name=May%20Tricks_6%20(1).png)
I know these tricks won't give you 30 extra lives or help you defeat Don Flamenco the second time, but they just might save you time.
To follow my blog, The Algebra Teacher Powers to B.I. click here.
If you want or need to increase your Power BI skills, Pragmatic Works On-Demand Learning platform is the perfect place to do it. Our 17 Power BI courses will turn you into a Power BI expert by providing in-depth instruction on all of the capabilities that Power BI provides. Click the link below to get started with a FREE trial!


-1.png)
Leave a comment