Power BI - Problem, Design, Solution - Folder Source Option for JSON Files

In this episode of the “Problem, Design, Solution” Power BI series, we will be talking about the “Folder” option inside the sources display for Power BI Desktop. This is a fantastic feature that works well with your standard Delimited/CSV (Comma Separated Value) files, making life easier by importing any files you have in a directory.
The only prerequisites that are needed in order to leverage this feature are that the files must be of the same file type and structure (same number of columns and names). There is one issue though-- even when meeting these minimal standards, sometimes the “Folder” option doesn’t load the files like we would want. This is the case when we talk about JSON files.
We will go on to explore how we can work around this issue by manipulating what the “Folder” option achieves but taking more control over the process. For those of you who appreciate a more visual approach, there is a detailed video at the end of this blog that you can skip to. Even so, this will be a very detailed and visual written complement to the video. I hope you enjoy!
PROBLEM
Traditionally, the “Folder” source option gracefully handles all of your delimited text files that are stored in a directory. This makes it extremely easy and quick to load that data into Power BI. Unfortunately, there are some common formats or structures that are used in text files that this option does not handle well, namely those in the JSON format. I will not be going into depth on an explanation of the JSON format as this whole blog is about how to load these types of text files into Power BI, so it is assumed that you know what I mean when I say JSON.
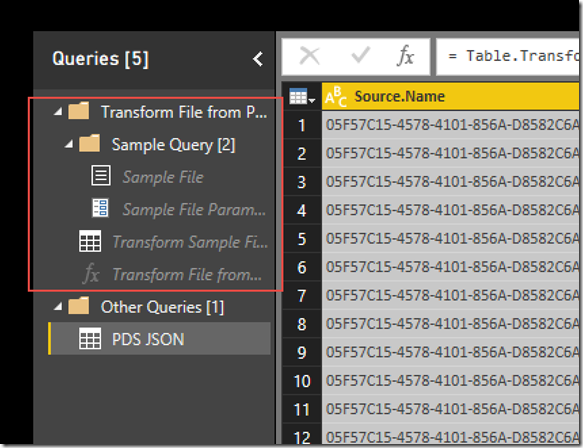
As you can see in the screenshot below, using the folder option is very simple, but the outcome of what is achieved is not desirable. We can immediately see that we need to pivot the information to better suit our needs amongst other things.
As you can see in the image below, after the “Folder” option performs all of its operations to bring the information into one table, you can see all the steps in the queries pane. There is a way to move through these steps and get the output the way you want it, but this can be time consuming. The reason I do not recommend this is because within the steps that are being taken, there is an order of dependencies. Usually when you make one change, you need to address those changes in another step that was dependent on the last one. Instead, let’s talk about a way to take more control of this process from the beginning, while taking advantage of the idea of pulling together all the data that exists in multiple files in a folder!
Design
Since we now understand how awesome the “Folder” option is inside of Power BI, we need to figure out how to make this concept work for our JSON files. To start, we can borrow from what we see in the previous screenshot. We won’t copy everything that the “Folder” option does, but definitely a large majority. Let's break it down:
1. We can see that there is an item that is pulling a sample file.
2. We also can note that there is a table where transforms are being applied.
3. Lastly, the “Folder” option is using a function to pass through the values of all files found in the specified directory.
So let’s now take these ideas and do them ourselves in four easy steps!
Step 1 – Point to One of the JSON Files in the Directory in Order to Apply All the Transforms We Want
The way we will achieve this is by first locating the “JSON” option inside of the list of source options in Power BI. Once selected, we will simply navigate to the directory we eventually want to load and select any of the JSON files that are there. It really doesn’t matter which of the files you choose, because we have already discussed that the files that exist here should already be of the same file type and structure. Once we have pointed to the file in question and hit “Okay,” the file will be loaded into the Query Editor. Once in Query Editor, we really only have one option here, to convert the data into a table format as seen below.
Once it has been converted to a table, you can now perform any transformation that needs to occur. In the video example, the only step we will take is to pivot the table and choose not to aggregate any of the values as seen below once again.
Also, I have gone ahead and renamed the table, “JsonFile”. We have now completed step one by pointing to a sample file and applying whatever transforms are necessary. Now all we need to do is find a way to get a list of all files that exist in the folder that we want to process…
Step 2 – Use the Folder Option to Point to the Directory in Question
WHAT?!?!?! We just talked about doing this in the problem portion just above, so why would we want to do this?
The answer is simple. We have already decided that the data isn’t in the right format when using the “Folder” option, but there is one thing it does do right. The first column that is created is meant to capture the source of where the data was brought from, which in our case is the file name, which is exactly what we want. So after we select the folder to import from, we can delete all columns except for “Source.Name”.
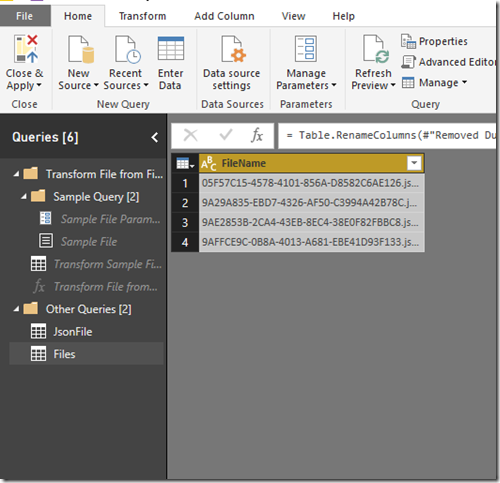
We aren’t done just yet though, because as you will quickly see, the filename is repeated for however many columns we had in the file, but Power BI gives us an easy solution. Go ahead and right-click the “Source.Name” column and you will see that there is an option to “Remove Duplicates." Let’s also rename this column to something friendly, like “Filename,” as we see below. Also, rename the table to something friendly if needed. In my example I have left it as “Files”.
Voila! Now we have a distinct list of filenames that appear in the directory. Also, the way this connection is setup, if files are added and/or removed, it will be able to keep up with these changes. So every time we refresh the connections, we will have an accurate list of what is in the designated folder. Step number 2 now has a checkmark next to it, but now we need to figure out how to tie both these steps together. We want all the transforms we setup in step 1 to apply to whatever files have been discovered in step 2. The answer, use a function!
Step 3 – Create a Function of the First Table Where We Transformed Our Sample JSON File
Here, we actually need to revisit the first table we created where we pivoted our table. We are going to modify the M query that was written in the background for us for this table. As you can see in the screenshot below, there is a line of M that indicates the type of source connection that was used and the specific path of the file we chose.
This is where we are going to make a change, but we must first declare a variable/parameter to the beginning of this query. The syntax will be as follows:
(file as text) =>
let
Source = Json.Document(File.Contents(“C:\Users\Manuel Quintana\Desktop\PDS JSON\Files\”&(file))),
#”Converted to Table” = Record.ToTable(Source),
#”Pivoted Column” = Table.Pivot(#”Converted to Table”, List.Distinct(#”Converted to Table”[Name]), “Name”, “Value”)
in
#”Pivoted Column”
As you can see in the query, we have removed the actual path of the file and replaced it with the parameter called “file”. Once we select the “Done” button, the table will change into a function and give you the option to pass a value to the parameter in order to invoke the function, but leave this alone for now. We now have all the pieces of the puzzle, we just need to put it all together.
Step 4 – Invoke a Custom Function to Create a New Column
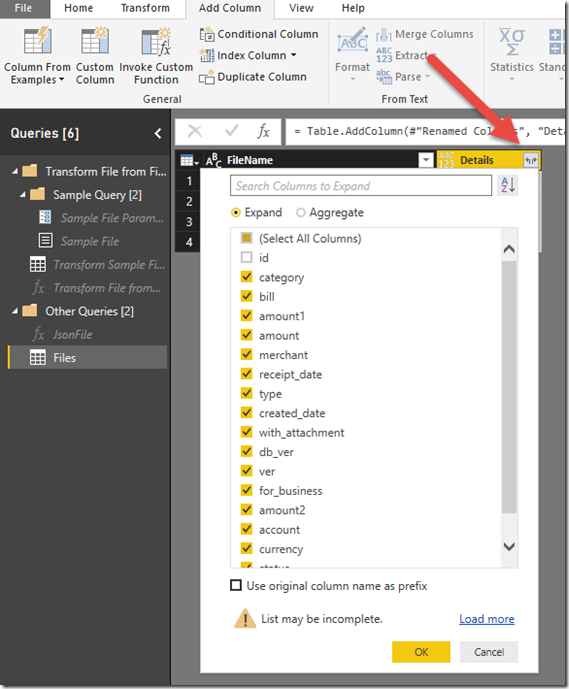
This is definitely the easiest and final part of setting up this design. Go ahead and select the table that was created in step 2. Now select “Add Column” in the ribbon at the top and we will be using the “Invoke Custom Function” option. As you can see in the image below, this will prompt a menu where we will need to give a name for the newly created column. In my case, I called it “Details,” but this really doesn’t matter as we will see very shortly. Next, we must specify which function we will be using from the drop down, mine is called “JsonFile”.
Lastly, we must decide what value we are going to pass to the parameter for this function. If we look back at our function, we are wanting to pass through the names of the files that exist inside of our directory, which is exactly what we have in this table within the “FileName” column! After selecting the correct column and hitting "Okay," the new column is created and we can see that it has some packed data inside of it, as seen below.
All you need to do is select the icon which appears inside of the newly created “Details” column and you will be shown a list of all the columns that are packed inside. I have opted to unselect the “id” column in my example because it is a duplicate of my “FileName” column. Also, at the very bottom you will see the option, “Use original column name as prefix." If you leave this checked when you hit okay, it will create all new columns that will look like \ “Details.ColumnName," where ColumnName will be replaced by each field that is coming from the JSON file. I personally do not use this option, as you can see below.
Now take a step back and look at the beautiful table you have created, which contains all the details of the JSON files inside of your chosen directory. What is also fantastic is that moving forward when you refresh this Power BI report, it will always bring back exactly what is in your directory, no additional effort needed!
Solution
With our design now fully implemented, we can hit “Close & Apply” and bring our data into the model to start visualizing and analyzing it. This design pattern can also be used in other scenarios. I personally have used this to cycle through different pages of a website in order to bring back all the information I was looking for. Functions can be an extremely powerful ally in Power BI!
Resources
Video of solution:
Sign-up now and get instant access
ABOUT THE AUTHOR
Free Community Plan
On-demand learning
Most Recent
private training


-1.png)
Leave a comment